The Complications and Strategies
In the first post of this two-part series, we introduced primary topics under the umbrella of cloud platform monitoring and went into a bit of detail for how they present specific challenges. In this follow-up post we’ll explore some of the state-of-the-art strategies for dealing with these issues and the additional complications that will arise when utilizing these techniques.
Compute
For instance failures, we need to consider the scope of the issues. Is it just one process, the whole VM, a rack, a whole data center, or even a region? Thankfully the cloud providers have given us some tools for thinking about these scopes. Servers map to VMs, racks roughly map to concepts used in placement groups, data centers map to availability zones, and regions to groups of data centers located geographically close to one another.
Since individual server or VM outages are the most common scope of instance failure, there are the most tools available for handling this level of unavailability. Examples for automatically bringing up new VMs exist both at the cloud provider level and platform level such as autoscaling groups, kubernetes replicasets or deployments, and so on, but there are nuances in utilizing these systems for stateful systems that even seasoned SREs might trip over to provide a fully-automatic resolution of instance replacement.
As a simple example, consider failing over a database primary instance due to VM failure. If the new instance comes up with a different IP, then you either need to update the DNS records that your applications are using or you need to update the IPs themselves wherever they were referenced if they had previously been hard-coded. The database connection string might not need to be updated in the former case, but will the underlying instances’ DNS cache where the application servers are running get updated? If it does, will the application reconnect using the new IP? How do you even know if and when the application has reconnected successfully?
Handling this seemingly straightforward failure often ends up involving far more than just robust application coding; the specifics of the OS the docker image was built on could get involved, as well as the underlying host OS and its container runtime. If you’re using a cloud provider kubernetes product, the specifics of its implementation will matter more often than not, especially when it comes to node and control plane versions. Furthermore, if you’re using a cloud provider DNS solution such as Route53 there could be API rate limits to worry about if there are already a lot of pending updates from normal operations also queued up.
Other challenges include failover promotion and the rebalancing that might need to occur if needed; if you have mechanisms in place to handle failover, make sure you test them ahead of time when and where downtime is acceptable. This is where chaos testing comes into play and it’s gaining traction for good reason. Along with failover, rebalancing your data is a common task that needs to be performed, so make sure you have good instrumentation on these operations so that you can be confident data is ready to be served again after the new node is up.
We’ll also take a look at strategies for dealing with larger scopes of hardware failures below.
Storage
Then there’s the storage to consider. Was the database using a local disk? If so, then that data is likely gone for good if the cloud instance unexpectedly dies, so you need to rely on restoring from a backup or switching to a replica. Backups have the annoying property of only being as up-to-date as the time of the last backup, so they’re typically only kept these days for catastrophic failures or data corruption where you actually desire taking your data back to a state from an earlier point in time.
If relying on a replica, then the replication delay is of critical importance; and it can be very difficult to keep replication delay very low if the primary is receiving lots of traffic, especially expensive but critical ETL jobs. There are also quite a few other considerations to keep in mind when promoting a replica to a primary, but that’s really a big enough topic for an entire additional post.
EBS can be a tempting alternative option so that the disks can be reattached to a new instance if you just lose the VM, but their bandwidth will compete with other networking loads and in general they will not be able to provide as many iops at as low of a latency. Still, EBS and similar network-attached storage solutions are incredibly popular and powerful these days, and a rapid time to recovery is a huge part of why that’s the case. If you can just bring up a new VM, attach to the same logical volume you had before you crashed, and start the service up basically where you left off, downtime can be drastically reduced.
There are other issues that can crop up which at first thought might be easier to deal with, but in practice can actually be trickier; in my experience your volume going into read-only mode or suddenly suffering much higher latencies are the two most glaring examples. If your system can emit enough storage metrics however, you should be able to treat the node the same way as if the storage was lost completely and start replicating and/or promoting a failover to gracefully move off the degraded hardware.
At Confluent we had to balance these tradeoffs carefully for each application, which often meant custom-tailoring the metrics we considered for storage health to each application’s storage architecture. We used a mix of local volumes, EBS and its parallels, and object storage; sometimes multiple choices even for the same service!
And just because you might be relying on S3 doesn’t necessarily mean your data will always be available; be sure to know the details of how S3’s availability SLAs work and be comfortable with them. For instance, just getting some credits back if your data is unavailable for a few hours might not be sufficient for your business’ needs. If this is the case, consider replicating the same data between regions for a greater measure of redundancy, or between cloud providers for even more. To assist with this you can leverage cross-region bucket replication, Google’s storage transfer service, or other similar tools.
Process
Early in my career, I was shown how to use daemons to specifically monitor other applications, and in fact this is common all over the *nix ecosystem; you’re probably already somewhat familiar with concepts from ubiquitous system process managers such as systemd or upstart. More purpose-built tools for monitoring the health of your main application include tools such as monit, but as we’ve moved into the era of containers, it’s more common to treat the lifetime of your process the same as the lifetime of the container where your application resides. To that end, we have robust container management platforms now, but that also means you have to bring the mechanics of the process health monitoring out of the container’s context and up into the orchestration layer, or ensure the container actually exists under absolutely every critical failure scenario.
Kubernetes and other similar platforms offer a lot of tools to assist with this but there are so many options here that getting the right mix of checks in place without going overboard requires exhaustive testing. For example, you really need to not only have a solid grasp of the difference between liveness probes, readiness probes, and startup probes, you also need to know when and how to implement each one. A well-designed system will carefully marry these platform-level capabilities to the specifics of your application architecture.
Network
Taking these examples further, how do you keep a cluster of services all in good working order with each other? What’s it mean for one instance of the app to be unable to reach the others if the others can all reach it just fine still?
It’s standard practice to have a health check endpoint / port if your service is designed to be reached over the network, but there is a chasm between simply checking for simple network connectivity and implementing meaningful endpoints in your application that actually do enough work to actually signify that the process is truly alive and well - including whether the necessary dependency applications are also functioning! In my experience it’s extremely common for developers to implement almost irrelevant HTTP or TCP health check endpoints within their applications that basically always return an ‘up’ response as long as the process is running, and in many cases this is actually done automatically by a built-in framework designed by a common platform team due to company policy. This is never done with ill-intent; it’s almost always done this way because it’s often necessary to get the application to work at all with modern load balancers or k8s liveness probes, and there is almost always an earnest intent to replace the simple endpoint with something more meaningful as soon as time permits.
The problem I’ve seen is that organizationally, this extra step is often never prioritized since as soon as an application is up and working there are more features to build.
Large-Scale Outages and Correlated Failures
If you’ve gotten this far and tested that everything works (and fails!) as expected, even when there are network partitions, I congratulate you! This is already a huge accomplishment. However, when the larger classes of failures start happening, enterprises and any other large deployment of services should still be designed to handle the outages as gracefully as possible. For instance, leveraging a cloud providers’ availability zones correctly can make the difference between an AZ outage causing a 33% reduction in capacity for 5 minutes vs. your entire site going offline until the outage is resolved the next day.
Instrumenting your applications and infrastructure sufficiently to handle all our previous examples will likely result in a massive monitoring ‘alert storm’ when one of these larger-scale outages occur, which can confuse and overwhelm on-call engineers. Even the best, state-of-the-art monitoring tools I’ve personally used still struggle at correlating large numbers of alerts simultaneously to make meaningful sense of an outage that isn’t necessarily the fault of your applications or smaller segments of your infrastructure. Instead, you’ll probably need to rely on the experience of your senior engineers and upfront operational architecture to ensure greater uptime.
Spreading your stateless applications across availability zones to begin with is a good start, but you have to be careful about how they get their state as mentioned earlier above. If you have a temporary loss of access to critical data, then a graceful fallback mode built into your applications should be designed and tested to serve up the most critical of functionality. For instance, maybe your social media app can’t take new posts but recent activity is still viewable from replicated caches. If the whole point of your application is to serve up stateful data, then you need to think about redundancy to make your service highly-available.
Kafka, for instance, is typically configured in the cloud to keep three copies of every partition, one in each of three availability zones. Yes, this means you’ll pay a premium when everything is working smoothly with no outages, both in storing the additional replicas of the data and in the network costs associated with transferring the data to be replicated between availability zones - but this price is worth it if your business needs to continue operating even if an entire availability zone is suddenly unavailable.
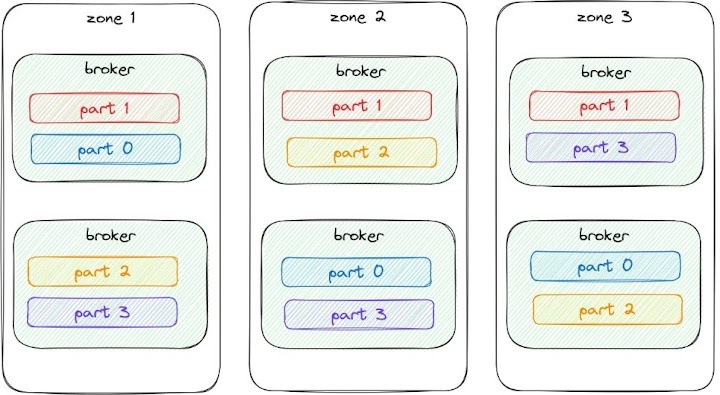 Kafka topic partitions within a single cluster spread across availability zones, with different partition⇔broker mappings in each zone.
This sort of a configuration has the added benefit of surviving single broker outages nicely as well as whole zone outages. The kafka client aids with this as it knows how to connect to all the brokers in a cluster directly. If your data application only connects to a subset of the nodes in a distributed databases, then just make sure those gateway nodes are still highly-available as well.
Like almost every other solution mentioned so far however, these techniques do come at the expense of hundreds of engineering hours of deep design and implementation work, as well as an often equal amount of testing and verification. The hosting costs of running each additional layer of redundancy also grows significantly; sometimes literally doubling if active-active replication is needed. Before embarking on achieving any specific resiliency goals, make sure you spend a decent amount of effort on the cost estimates!
Summary
Hopefully these two articles have given you a deeper insight into both how to go about getting your cloud platform to that next level of high-availability and how difficult it can be. In our next post in this series we’ll explore how the need for monitoring extends beyond simply handling failures - you also need to know when to scale up your infrastructure, and the various ways that can be done.