By far the most consistent area of focus I’ve had in my career is monitoring and observability. Way back in 2005 while at Orbitz, I had the opportunity to learn from and work alongside Chris Davis, the original author of Graphite. It was an enormous success both at Orbitz and within the industry as a whole, and it’s been an honor and privilege to essentially ride that initial wave of monitoring innovation my whole career.
6 years later, another adjacent area emerged as my second-most common area of focus, and that is the collection of specific metrics used to quantify end-user usage, which are typically used to generate the bills for SaaS companies which have any sort of pay-per-use cost dimensions. Even including Omnistrate, I’ve now had direct involvement with the design and development of the metrics systems and/or billing integrations for the past 5 companies I’ve worked at over the past decade, and it’s incredible to me how similar the problems and solutions have been even when the industry or design of each business’ technical architecture has been so different from each other.
In today’s post I’d like to explore the internal complexities of SaaS billing systems and what challenges and design patterns for addressing them keep showing up. Hopefully by the end of this you’ll have a better understanding of how SaaS billing works and a blueprint for how to go about implementing it yourself if you need to.
Generating Metrics
The first and arguably most important part of having a way to bill your customers is the generation of the metrics which will be used as usage components. I think there are basically three groups of these metrics, so let’s go through each of them.
Application Generated
These will likely form the bread and butter of your billable metrics, and can take many forms. In the adtech industry, common examples include page views, events like clicking or hovering over UI elements, and so on. At Confluent, we measured bytes transferred by the brokers and counted partitions which is another example of application metrics. Simply generating these metrics isn’t enough - and we’ll cover capturing metrics later - but what you mainly need to be careful of at this stage is that you’ve really thought through the business requirements of the billable metric itself and are comfortable with what the metric means exactly.
As an example of what I’m talking about, consider Apache Kafka and its bytes transferred metric. If you’re trying to make sure the bills you generate for your customers regarding data transfer will cover your own data transfer charges from the underlying service provider, then you need to make sure all details are accounted for, including compression, protocol and connection management overhead, and the charges related to network transfer that won’t have anything to do with the application itself; e.g. NAT gateways, cloud load balancers, interzone or interregional data transfer, and so on.
And if you’re tracking application events, you’ll want to make sure you’re really getting all the events you might want to count, even if you’re not sure exactly which ones you want to bill on to start or how much you want to bill on them. This will give you a better picture of what your users are doing and which dimensions correlate strongest with your actual hosting costs.
Machine Sampled
The next group of metrics I’ve seen used to great success are what I’ll call machine-sampled - these generally will come from your monitoring agent of choice and can include anything from memory usage, i/o operations, CPU utilization for your process, and so on. You might not initially think that these would ever be used as billable usage metrics, but there are cases where these make the most sense, such as when you’re more of an IaaS and you’re literally charging your customer for the total memory utilization of a set of carefully-controlled processes.
Infrastructure or Service Provider Captured
Finally, you could also rely on the underlying service provider for the metrics they generate regarding your usage of their platform for your own billable usage metrics if it makes sense. Some examples of these metrics would include cloudwatch metrics from EC2 and ELB, or the detailed billing report usage metrics you get from your cloud providers’ bills. There is a fairly hefty downside to using these though, and that’s they tend to be quite delayed, and in some cases, they can be very delayed (up to a day or several late).
Difference between operational metrics and usage metrics
Regardless of the source or type of the metric, we also need to take a moment to discuss the important relationship between metrics for operational use and metrics for billing usage. In many cases, and in fact all cases where I had a personal hand in working on these systems, SREs such as myself would often rely on the same usage metrics we used to bill our customers as useful information for debugging issues with our services and ascertaining the overall health of the platform. But the critical difference here is in how you handle these metrics - while it is generally OK for a few operational metrics to get lost here and there, it’s generally A Very Bad Thing® if you lose or corrupt any billable usage metrics.
As we explore the rest of the subsystems that power billing pipelines, this will become more evident, but even at the moment of data generation it’s extremely important to keep robustness top of mind. My favorite example of this is you’ll need to consider what happens to metrics currently being counted in memory when an application gets restarted or even killed unexpectedly. Were there important metrics that were lost? If so, what’s your tolerance for this? Could you have prevented it by having a controlled shutdown that waits until your currently-buffered metrics have been flushed to a metric collector?
Capturing Metrics
This hypothetical leads us nicely to our next phase, the capturing of metrics. If you’re familiar with prometheus then you’ll understand this as the contact point of the prometheus endpoint which exposes your metrics via http, and the prometheus scraper(s) which calls these endpoints regularly to harvest the metrics. Prometheus isn’t the only way to do this though; here are a few other methods which I’ve also used personally or read about:
- Implementing a producer in your application to push metrics to a messaging service like Kafka
- Putting a store-and-forward service like scribe between your application and a database or messaging service
- Utilizing a metric collector like the datadog agent or similar open source collectors
- Exposing your metrics via JMX and using a collector or metric agent to scrape this instead
Regardless which specific technology you select, you’ll either be pushing your metrics directly to another service or running a collector which scrapes an endpoint your application exposes. The main difference in these approaches is that it’s harder to guarantee every metric has been counted with a scrape-based approach vs. a push-based system. The trade-off here though is that a push-based system gives your application a hard dependency on the downstream service always being available, so you’ll want to make sure you consider this decision carefully.
Aggregating and Storing Metrics
Assuming your metrics have made it into a collector, now you need to aggregate and store them, and this is personally my favorite part of the overall design to focus on. The main factor which will determine how you want to approach this facet of the overall system is your scale - if your total architecture spans a single region and no more than a few dozen machines, then you can easily run your billing metrics system with a single database, messaging system, and a small fleet of collectors. For example, you could just use Postgres or a more purpose-built metrics DB to store your metrics, kafka to durably store and transport your metrics, and implement producers in each of your applications to guarantee usage metric delivery. A custom-built kafka consumer or stream processor application could aggregate your metrics into appropriate time buckets and store them durably in Postgres.
As you increase the scale of your system, you will likely need to increase the complexity of this subsystem; at Signal, we had a good-sized fleet of application servers numbering in the hundreds and spread out across four AWS regions around the globe. These regions each had a fleet of MongoDB servers, which served as the sinks of our store-and-forward service, which implemented a scribe destination and ensured that every single billable event got upserted into mongo just once (in ad-tech, your customers will constantly be checking that every single page click shows up).
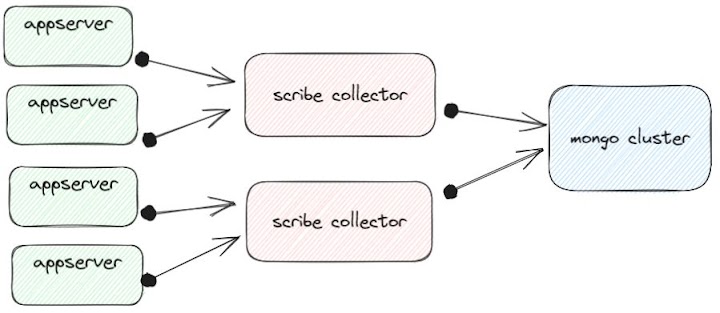 Each region’s usage metric aggregation pipeline at Signal
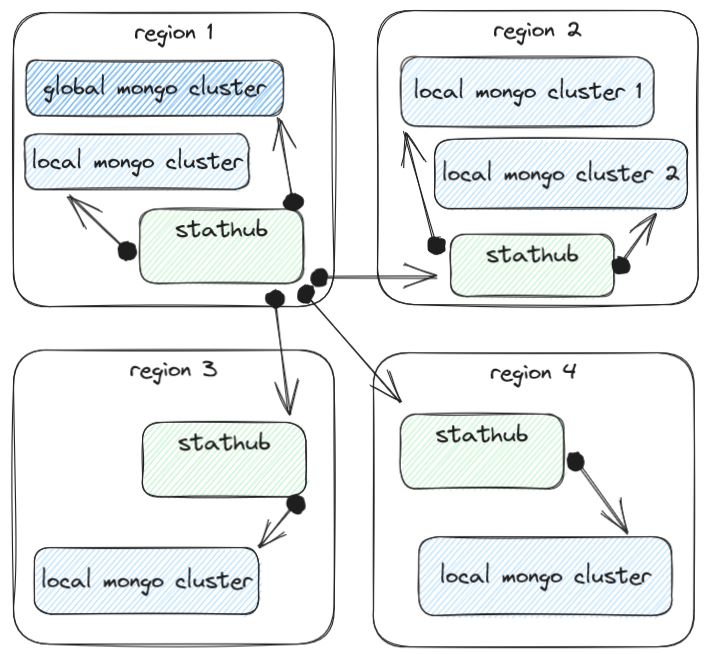
To aggregate the metrics from all regions into one place, we had a hierarchical read path service called stathub. It was as simple as it was effective - it could read from mongo and also other stathubs, and knew how to aggregate the results when reading from multiple clusters or downstream instances of itself. This was important because some regions were very large and needed multiple mongo clusters to handle the throughput there:
At Confluent, we also had massive scale metric generation, with the number of kafka clusters reporting metrics in the thousands. To handle this metric load in a reliable fashion, we used a massive reporting kafka cluster specifically designed to handle just these metrics:
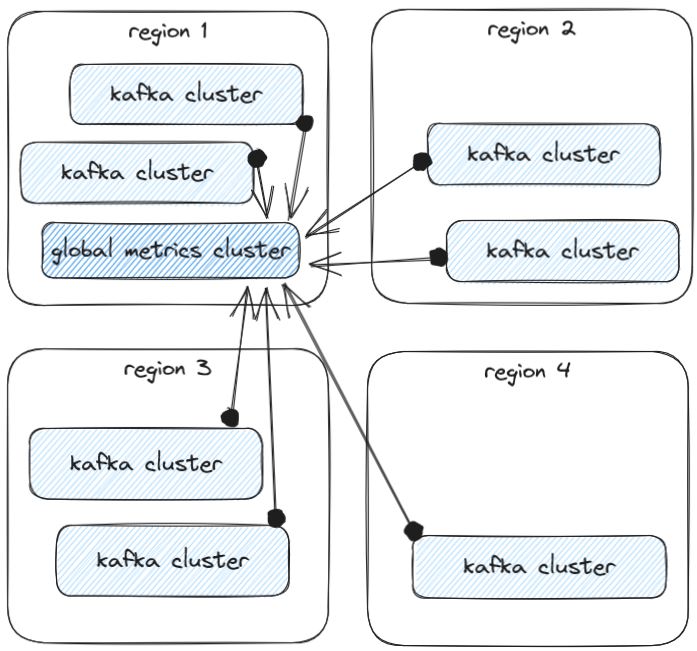
You can read more about how Confluent handles the storage and aggregation of all their metrics in Druid here.
Regardless of the approach you choose to get your metrics to their final resting place, you’re going to want to choose a database that fits your needs. At massive scales, purpose-built time-series databases can be an excellent choice for their efficiency and performance, but be sure to watch out for any optimization techniques which compromise data integrity - remember that operational metrics can generally lose some fidelity while this is not the case for your billing usage metrics.
Usage Report and Bill Generation
Once you have all your metrics aggregated and stored, you can finally generate some bills! The main quality of your billing service is going to be running scheduled jobs to slice up all the numbers in your metrics DB along customer and usage dimensions, summing them up into whatever granularity you want to provide to your customers. The cloud providers’ own billing systems do this in surprisingly high fidelity - down to the second in some cases - but the most common time aggregation I’ve seen is hourly sums. Even daily, weekly, or monthly aggregates are fine if they’re appropriate for your product and customers’ use cases. The results of these calculations are typically stored right back into the same database or a durable object storage (or even both!) for painless retrieval in the billing section of your product.
Bill delivery and Payment Processing
The final step in making this all work so you can get paid is to deliver these bills to customers and provide them an easy mechanism to pay you, and to be honest, for this aspect, I’ve almost always just used one of the excellent third-party payment processor companies that exist. They all tend to have fantastic documentation, integration support, and invaluable staging environments which let you build out everything discussed here and even generate fake invoices which can be paid with fake credit cards. Be sure to take advantage of this to ensure all aspects of your billing pipeline are working as expected.
Summary
We have just scratched the surface, the reality is that the problem is much more complex. We have to worry about SOX compliance, aligning ids across different provisioning and billing systems, auditing billing records, monitoring the billing pipeline, handling product skew and free trials, and integrating with marketplaces, and so on.
As you might be able to tell by now, I love working on these systems. They’re critical to make your business succeed, they need to be bulletproof, and they can end up being forced to reckon with massive scale. As an engineer, this intersection of difficult requirements excites me and it’s been an honor to work on them multiple times now. I hope you’ve enjoyed this brief introduction to the space and hopefully you can apply anything you’ve learned to whatever you're working on now or in the future.